Market Potential: What Attendance Volume Can Cultural Entities Expect in 2020? (DATA), Colleen Dilenschneider, 5 August 2020
If museums and performing arts entities were all reopened and did not need to limit capacity, what level of attendance could they expect to achieve throughout the rest of 2020?
Several individual institutions with which we’re affiliated have reached out to us to ask about the cultural industry’s market potential forecast in terms of expected attendance for 2020 and the foreseeable future. Those that have already reopened are wondering if they are tracking favorably with expectations, and those that remain closed are wondering what to realistically expect when they eventually reopen their doors to the public.
Today, we’re sharing the broad market potential expectations for both exhibit-based and performance-based cultural entities. In other words, upon reopening, what sort of attendance levels should an organization expect to realize in 2020 and how long will it take to return to the more normal levels of attendance observed in a pre-pandemic period?
We’re also providing an update on intentions to visit cultural organizations in this article. Since COVID-19 was declared a national emergency on March 13th, we’ve been publishing data every Monday on intentions to visit cultural organizations. (We cannot decide if those last twenty weeks have felt very long, or very short.) We’ve observed that intentions to visit cultural organizations, on the whole, are low but stable across in the United States when compared to last year’s numbers. As of this week, we’ll now publish intent to visit metrics on the first Wednesday of each month alongside any changes in the market potential data that we are debuting today.
Get cozy and refill your coffee mugs! It’s time to dive into some particularly important directional data for cultural organizations.
What is market potential for cultural entities?
Market potential for cultural enterprise is a modeled measure of the size of the market for these experiences at a specific time. This type of analysis is the product of modeling robust data relating to the US public’s attitudes, perceptions, and behaviors concerning cultural enterprise. Market potential studies leverage data concerning visitor behaviors to develop models of both the market and the experiences offered to the public by cultural organizations and quantify the outputs of the simulated interactions between these two models during a defined duration to produce a data-informed attendance forecast.
Market potential analyses are helpful for informing planning expectations. In particular, they can help shine a light on answers to two key questions right now:
- What is a reasonable attendance expectation for organizations in 2020?
- How long will it take for attendance levels to return to “normal” (i.e. pre-pandemic) levels?
For this article, we’re considering market potential in terms of onsite attendance numbers (i.e. volume of visitation). This type of data modeling is the type of practice that IMPACTS Experience conducts regularly on behalf of its clients, as it proves historically reliable as a means of projecting annual attendance levels. Typically, market potential assessments are developed for a single specific organization. In this article, however, we’re pulling back to examine market potential for the cultural sector as a whole, organized by exhibit-based and performance-based organizations. By sharing this data, we’re trying to inform a sense of realistic expectations going forward as organizations recalibrate their business and audience engagement plans.
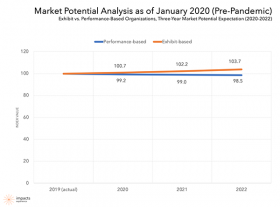
First, let’s look at what market potential was for 2020-2022 before the pandemic struck. In the data below, 2019 total attendance numbers are represented by a value of 100. Some entities welcome one million visitors and some welcome ten thousand visitors. Standardizing actual past attendance numbers to an index value of 100 allows us to collectively consider attendance for many institutions at once in order to compare past performance to future engagement opportunities. This allows us to quantify expectations in terms of likely changes relative to past performance.
For example, a future market potential value of 110 when compared to a baseline value of 100 would suggest a 10% increase in expected attendance. The outcomes of the market potential models completed in January 2020 indicate that an exhibit-based organization welcoming 100,000 visitors in 2019 could have reasonably expected to welcome 103,700 visitors in 2023 (if the pandemic hadn’t happened).
A multiplicity of factors influence market potential: awareness, negative substitution (not reaching new audiences fast enough), attitude affinities (how welcoming entities are perceived to be), prevailing market conditions, and competition. These models can also consider natural disasters, civil unrest, crime and terrorism, and other “black swan” type of incidents that stand to impact market potential. While we know that these events are rare, 2020 has taught us that their impacts can be profound and lasting. (Oof!)
So where do things stand as of this month in light of closures, the economy, and the coronavirus?
What percentage of 2019 attendance can exhibit-based entities expect in 2020?
Exhibit-based cultural organizations include entities such as museums, historic sites, aquariums, zoos, botanic gardens, and science centers. The current market potential for exhibit-based organizations for the calendar year 2020 is 37.2% of their 2019 attendance.
In other words, a generic exhibit-based organization that welcomed 100,000 visitors onsite in 2019 should expect to similarly engage 37,200 visitors in 2020. This estimate contemplates both periods of closure and reduced or redistributed demand upon reopening.
Market potential is – as the name suggests – based upon potential attendance. It does not contemplate attendance limitations due to coronavirus capacity constraints. Instead, this type of modeled analysis considers potential attendance in total. It’s possible that some entities will not achieve the indicated levels of market potential, due to social distancing and other limitations.
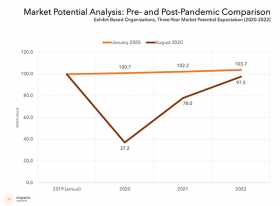
Even without another wave of closures, attendance is not projected to return to 2019 levels until 2022. This is critical for organizations to anticipate for planning purposes. Museums are unlikely to simply pick up where they left off in terms of attendance once there is a vaccine available.
What percentage of 2019 attendance can performance-based entities expect in 2020?
Performance-based cultural organizations include entities such as theaters, symphony/orchestras, and ballets. The current market potential for performance-based organizations is 23.3% of their 2019 attendance.
Again, market potential does not contemplate capacity restrictions due to the coronavirus and social distancing/safety precautions, and assumes that programming is essentially similar to previous years.

This may be especially disconcerting for performance-based organizations, which were already experiencing decreased market potential over time. Theater audiences, in particular, can vary significantly based upon the offered programs. And the negative substitution of historic audiences to symphony/orchestras in the United States is an obstacle that these entities were in the midst of tackling. (De-jargoned: The historic audience for symphony/orchestras is aging and not being replaced by a younger generation at a pace that allows for stable market potential.)
Why does general market potential analysis matter for individual organizations?
This is a data-informed, industry-based benchmark for attendance projections. This type of metric is vital for “right-sizing” operations and facility requirements. Your organization needs different staffing and operating plans to welcome 1,000,000 visitors than to welcome 50,000 visitors.
This information can also help organizations know if they’re doing a good job. For example, in 2021, an exhibit-based entity doing 85% of its 2019 attendance levels might be otherwise despondent… but with the context of this type of analysis, the organization knows that the industry expectation is 78% of attendance, so achieving 85% may actually indicate a job well done.
Remember that this analysis contemplates the industry at large and actual performance will vary by individual organizations. This isn’t your unique organization’s projected attendance. It represents an industry average to provide a benchmark. Some exhibit-based cultural entities are experiencing increases in demand right now, and these organizations may exceed the indicated averages for market potential. Other organization types may struggle to achieve the indicated market potential.
This article doesn’t tell you your specific organization’s attendance volume for 2020. Instead, it provides you with a data-informed benchmark that aligns scale and timing. This information suggests that (a) it will take time to return to normal, and (b) organizations should plan based on assumptions of lower volume, even if capacity restraints are lifted.
August update on intentions to visit
Intent to visit is among the best available metrics for reliably predicting behaviors and it also historically correlates with actual attendance. It helps us understand people’s plans for future visitation at any given time, and further aligns these intentions to a specific chronology. This metric not only quantifies the strength of intentions to visit an organization but also identifies the duration within which one intends to manifest this intention. A good way to think of these scalar values is as a measure of the relative certainty of an intended behavior being actualized. Thus, a value of “1” would indicate no intentions whatsoever to visit an organization, whereas a reported value of “100” would suggest that the respondent was essentially waiting in line for the doors to open. This data is durable over the years, and a change of only one point is statistically significant.
The relationship between market potential and intent to visit is an important one – intentions to visit are among the most critical data points contemplated in a market potential model. Intent to visit is an input for understanding modeled market potential. Without first collecting data to better understand the market’s intentions in terms of their leisure behaviors, it would be challenging to develop a data-informed analysis that quantifies these intentions (and other factors) in terms of expected visitation.
Today we’re sharing information collected through August 3, 2020. The research quantifies the US adult public’s intentions to visit 84 unique cultural organizations within the United States – from art museums and aquariums to theaters to symphonies. For the week ranging from July 26 – August 3, the data and analysis summarized below represent an additional sample of 2,119 US adults. As usual, this metric contemplates plans to visit any kind of cultural entity – either exhibit-based or performance-based.
As coronavirus cases in the United States continue to rise, we’re predictably observing low intentions to visit cultural entities in the immediate near term. Unfortunately, one-month and three-month intentions to visit cultural organizations took a dip this week as well. Intentions to visit cultural organizations historically decrease slightly from the end of June to the end of July. This happens due to seasonality. Cultural organizations generally have the greatest volume of visitation in the summertime months. By the end of July, three-month intentions to visit are squarely in the fall season, when fewer people generally visit cultural organizations.
Nationally, near-term intentions to visit are still notably depressed compared to last year. The first chart shows what things looked like in 2019, and the second shows 2020.