Te Papa was one of the top three museums measured by the sentiment score. Photo by Maarten Holl. Source: Te Papa.
Nicolay Gerold, Museum Rankings based on Visitors Sentiment, 29 November 2021
Authors:
Nicolay Gerold – Graduate Student of Mgt & Technology at the Technical Uni of Munich.
Prof. Dr. Isabell M. Welpe – Chair of Strategy & Organization at TUM School of Management.
I. Interesting Findings
- Among the top three museums measured by the sentiment score is one museum from each group of museums: 1. Cleveland Museum of Art 2. Te Papa Tongarewa 3. Universeum.
- Natural history museums seem to resonate the most with its visitors, whereas technology museums appear to invoke the lowest delight.
- The three top museums have an increasing focus on digitalization and on a multi-channel engagement with its customers, which seems to engage its visitors.
- There doesn’t seem to be a connection between the size of the museum and the sentiment score as large, medium, and small museums are equally distributed among the range of sentiment scores.
- The overall positive word clouds of all museums and the positive average sentiment score among all museums show that there may be a selection bias in the visitors, who write reviews.
- Many of the top museums have a dedicated group of people working on the incorporation of new technologies into the museum emphasizing the suitable display of the exhibitions and the education of the visitors about the exhibited content. This emphasis may account for the higher attractiveness of the top museums.
- The two top museums — the Cleveland Museum of Art and the Te Papa Tongarewa — use digital tools to engage the audience before and after the visit bringing the experience into the homes and phones of the visitors.
II. Introduction
Cultural industries like many other industries currently face multiple challenges, e.g. through digitalization and the Corona pandemic. Museums like many companies in the travel, tourist, and hospitality industry had to tip-toe around the economic challenges the Covid-19 pandemic created: Travel restrictions, social distancing, masks, and closures of public places created unique conditions for museums to operate in. In 2020, the most visited museum in the world, the Musée du Louvre reported one of the lowest visitor counts ever experienced with a 72% drop in visitors compared to 2019. A similar development occurred in most heritage sites and museums around the world. Over 80% of UNESCO World Heritage is closed down or operating at a very limited capacity.
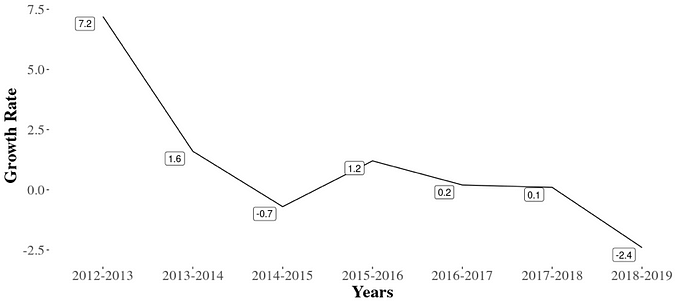
For museums one central measure of success and the main focus for many museums is their number and sentiment of their visitors. The AECOM analyzes each year the visitor numbers of popular tourist attractions in its Museum Index. If we take a closer look at the attendance of the most visited museums of the world, it paints an alarming trend. The pandemic accelerated an emerging negative trend that started long before Covid-19. The 20 most frequently visited museums around the world showed a 2.4 % decline in visitors before the pandemic after a few years of constant visitor counts. The growth in attendance in the twenty most visited museums declined from 7.2% to -2.4% over the course of the last 8 years from 2012 to 2019 and these numbers predate the Covid-19 pandemic.
Many museums today are struggling to compete for the attention and leisure time of its visitors with new competitors such as Netflix, Tencent, Khan Academy, or Epic Games, which winning the war for consumer attention, especially in younger generations. These competitors design some very addictive and beloved products and are today’s audiences’ main sources for education, entertainment, and dialogue. Their products have an inherent vitality among young generations and are talked about, tweeted about, and shared to create an euphoric word-of-mouth. The pandemic only expanded the word-of-mouth to other customer groups like older generations creating new customer demands for education, entertainment, and dialogue for the museum among all visitors.
Many museums are already in the process of reinvention by introducing new technologies like AR and VR into the museums and by bringing the museum experience into the home of the audience. But the visitor studies suggest that the visitor count fails to capture the delight of the museum experience in the new age. For the museums to improve, they need a validating metric, which accurately measures the attractiveness of the museum experience to the visitors.
But how do we measure the delight of the museum experience? We will explore a quantitative assessment by the museum visitors themselves to demonstrate how the visitors judge the museum and how they feel about the museum experience. We hope this approach can help museums get up to date feedback on their activities and initiatives that helps them increase their attractiveness to their visitors.
III. Research Methodology and Research Question
We aim to measure the delight the visitor feels in the museum experience. A sentiment is the feeling or delight expressed from a consumer towards a product, service, or experience. A sentiment score quantifies the expressed feeling though the used expression. For example, the sentence „I loved my visit at the Louvre.“ expresses the positive feelings of the visitors to his experience at the Louvre and would be scored with a positive sentiment score through a sentiment analysis.
A sentiment analysis interprets and classifies the emotions in product or service reviews by determining the sentiment of singular words, phrases, sentences, or documents. The sentiment of a review needs to be assessed on a sentence level to avoid neglecting the broader context of the sentences, e.g. negation. We used the R-package “sentimentr” to consider valence shifters, like negators, amplifiers, de-amplifiers, and adversatives.
• Negators („I do not like it.“) shift the sign of a polarized word.
• Amplifiers („I really like it.“) increase the impact of a polarized word.
• De-amplifiers („I hardly like it.“) reduce the impact of a polarized word.
• Adversatives („I like it, but it’s not worth it.“) overrules the previous clause containing a polarized word.
The analysis is done with the help of a dictionary of words. A dictionary in this context refers to a list of polarized words either classified as positive or negative one indicating positive or negative sentiment. The word is compared to the context of the sentence to determine the word sentiment score on a sentence level. Amplifiers, de-amplifiers, negators, and valence shifters change the sign of the sentiment and in- or decrease the value of the sentiment. The score can aggregated to the sentence or text level by calculating the mean score of all the contained words (Rinker).
By calculating the sentiment scores of each TripAdvisor reviews of the different museums, we can track the evaluation of the museum by its visitors over time with a quantitative measure. The quantization to a common scale allows us to compare the expressed delight towards the different museums and make inferences about the quality of the museum experiences and the quality of the adopted measures of the museum. We will show how the sentiment scores of different Art, Science, and Natural History museums developed over time.
In order to display the expressed sentiment of the visitors towards the museums, we use word clouds of the most frequently associated words color coded for positive sentiment (red) and negative sentiment (blue).
IV. Comparisons
Intra-Groups Comparisons
We have aggregated the data for all Art, Natural History, and Science & Technology museums. As the focus was placed on Science & Technology museums, the sample for this group is significantly larger, which may lead to a more accurate picture of the sentiment. Due to the large number of reviews and the large sample of sentiment scores of the Louvre, the aggregated score for the Art museums is significantly biased towards the sentiments scores of the Louvre.
The sentiment score of the three groups show some slight deviations around their respective group mean until 2018. After 2018 the Art and Science & Technology museums showed a slight downwards trend, while the Natural History museums showed a slight upwards trend in their sentiment scores. These trends are also represented in the world clouds of the most frequently used words in the museum reviews, where the word cloud of the Natural History museums are entirely positive whereas the word cloud of the Art and Science & Technology museums contain some negative words. The Natural History museums seem to give rise to a higher delight in their customers and seem to improve the customer experience significantly.