National Visitor Survey Results December 2020, Tourism Research Australia, March 2021
Our National Visitor Survey results provide statistics on how Australian residents travel within Australia.
You can find national, state, and territory results for the:
- number of trips taken
- number of nights spent on a trip
- amount spent on a trip
You can also:
- read about the factors influencing travel within Australia
- see the changes compared over various timeframes impacted by bushfires and Coronavirus (COVID-19)
Key results
Domestic trips and spend
For the year ending December 2020:
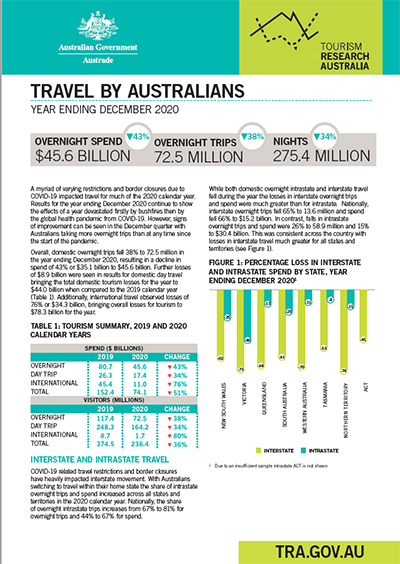
- Domestic overnight trips fell 38% to 72.5 million.
- This resulted in spend falling 43% or $35.1 billion to $45.6 billion.
For the December quarter 2020:
- Spend was down 31% to $14.2 billion and overnight trips were down 26% to 21.7 million. This was an improvement on the 53% fall in spend and 42% fall in overnight trips in the September quarter.
- Intrastate continued to drive the recovery in domestic overnight travel. Intrastate spend was up 22% ($1.9 billion) and the number of nights stayed were up 5%.
Total tourism
For the 2020 calendar year, total domestic and international tourism losses were $78.3 billion. These losses comprised:
- $35.1 billion for domestic overnight travel
- $8.9 billion for domestic day trips
- $34.3 billion for international travel.
Download the report
National Visitor Survey results December 2020 ( PDF 265KB) | (
 Word 441KB).
Explore overnight trips data
Interact with our data for domestic overnight trips for the year ending December 2020. You can view the data by:
- state or territory
- capital city or region
- interstate and intrastate trips
- accommodation type
- reason for travel
Data tables – read/view more