Colleen Dilenschneider, Market Potential by Quarter in 2023: Projected Attendance to US Cultural Entities (DATA), Know Your Own Bone, 4 January 2023
Based on the latest available data and most recent modeling efforts, here is the overall volume of visitation that the US museum and performing arts cultural sector can reasonably expect in 2023.
To kick off the New Year, we are sharing our single most boardroom-referenced annual article: market potential for the upcoming year. These data intend to provide a measure of data-informed sector “ground-truthing” to help inform your own organization’s expectations and plans.
Since the onset of the pandemic, a myriad of factors have influenced attendance over the course of the past few years, making data-informed attendance projections even more important. IMPACTS Experience works with several partners in the United States to harness sophisticated technologies that reliably estimate industry-wide annual attendance expectations with historic variances compared to actual attendance typically landing in the 2-5% range. Despite major changes in our uncertain and ever-changing environment, actual end-of-year attendance for US cultural organizations in 2022 landed at a 3.4% variance from the original projections published at the start of the year. This result points to the power of science and math to provide a sense of informed calm in our volatile world.
Let’s get to it! Given the current condition, what attendance levels can US cultural organizations generally expect to achieve in 2023?
What is market potential for cultural entities?
This is an important place to start if you’re not familiar with our modeling processes at IMPACTS Experience. Annual market potential for cultural enterprise is a modeled measure of the size of the market’s likely engagement with visitor-serving experiences over the course of a given year. At IMPACTS Experience, it is the product of modeling robust data relating to the US public’s attitudes, perceptions, and behaviors concerning cultural enterprise. Market potential studies leverage data concerning visitor behaviors to develop models of both the market and the experiences offered to the public by cultural organizations. The outputs of the simulated interactions between these two models during a defined duration are quantified to produce a data-informed attendance forecast. You can learn more about this process here.
For this article, we’re considering market potential in terms of onsite attendance (i.e., volume of visitation) to inform a sense of realistic expectations. The research in this article provides a benchmark for the overall market potential for both exhibit-based (e.g., museums, zoos, aquariums, historic sites, botanic gardens, etc.) and performance-based entities (e.g., symphonies, theaters, ballets, operas, etc.) in the United States.
Typically, market potential assessments are developed for a specific organization. The research in this article, however, is a composite intended to provide a broad direction for the cultural sector as a whole rather than the exact numbers for any individual organization. For example, a zoo in Texas likely has a different market potential than a children’s museum in Los Angeles, even though they are both included in the “exhibit-based” category. To better understand your own organization’s specific attendance projections, you’ll need a more individualized analysis. We can help you with that.
Many factors influence market potential: awareness, negative substitution (not reaching new audiences fast enough), attitude affinities (how welcoming entities are perceived to be), prevailing market conditions, and competition, to name but a few. These models can also consider factors such as natural disasters, civil unrest, crime, terrorism, and other “black swan” types of happenings.
What attendance can exhibit-based entities expect in 2023 by quarter?
Exhibit-based cultural organizations include entities such as museums, historic sites, aquariums, zoos, botanic gardens, and science centers. The actual attendance to these types of cultural entities in the United States averaged 96.4% of their 2019 attendance levels in 2022 (up from 79.7% of 2019 attendance in 2021). As of January 2023, the current market potential for exhibit-based organizations for the calendar year 2023 is 98.6% of their 2019 attendance. In other words, a generic exhibit-based organization that welcomed 100,000 visitors onsite in 2019 should expect to similarly engage 98,600 visitors in 2023.
Remember that this information may serve as a helpful benchmark for planning, and it includes a range of exhibit-based cultural organizations. In terms of straightforward numbers, most exhibit-based organizations in the US are back to 2019 attendance or above. (Some organizations also contemplated in the research had a particularly good 2022!) However, some individual organizations performed dramatically worse than their 2019 attendance levels, and these subpar results are negatively impacting the mean values indicated herein. It is also worth noting that some organization types are performing much better than others in general. For instance, zoos are dramatically outpacing children’s museums by not only returning to 2019 attendance but, in many instances, surpassing it.
Market potential is – as the name suggests – based on potential attendance. While it contemplates known constraints (such as increased competition for out-of-home activities, variant infection information, economic concerns, etc.) in its models, it is unable to address previously unknown factors or conditions with certainty. For example, if a new coronavirus variant emerges and we return to dramatically limited capacities… then projections change.
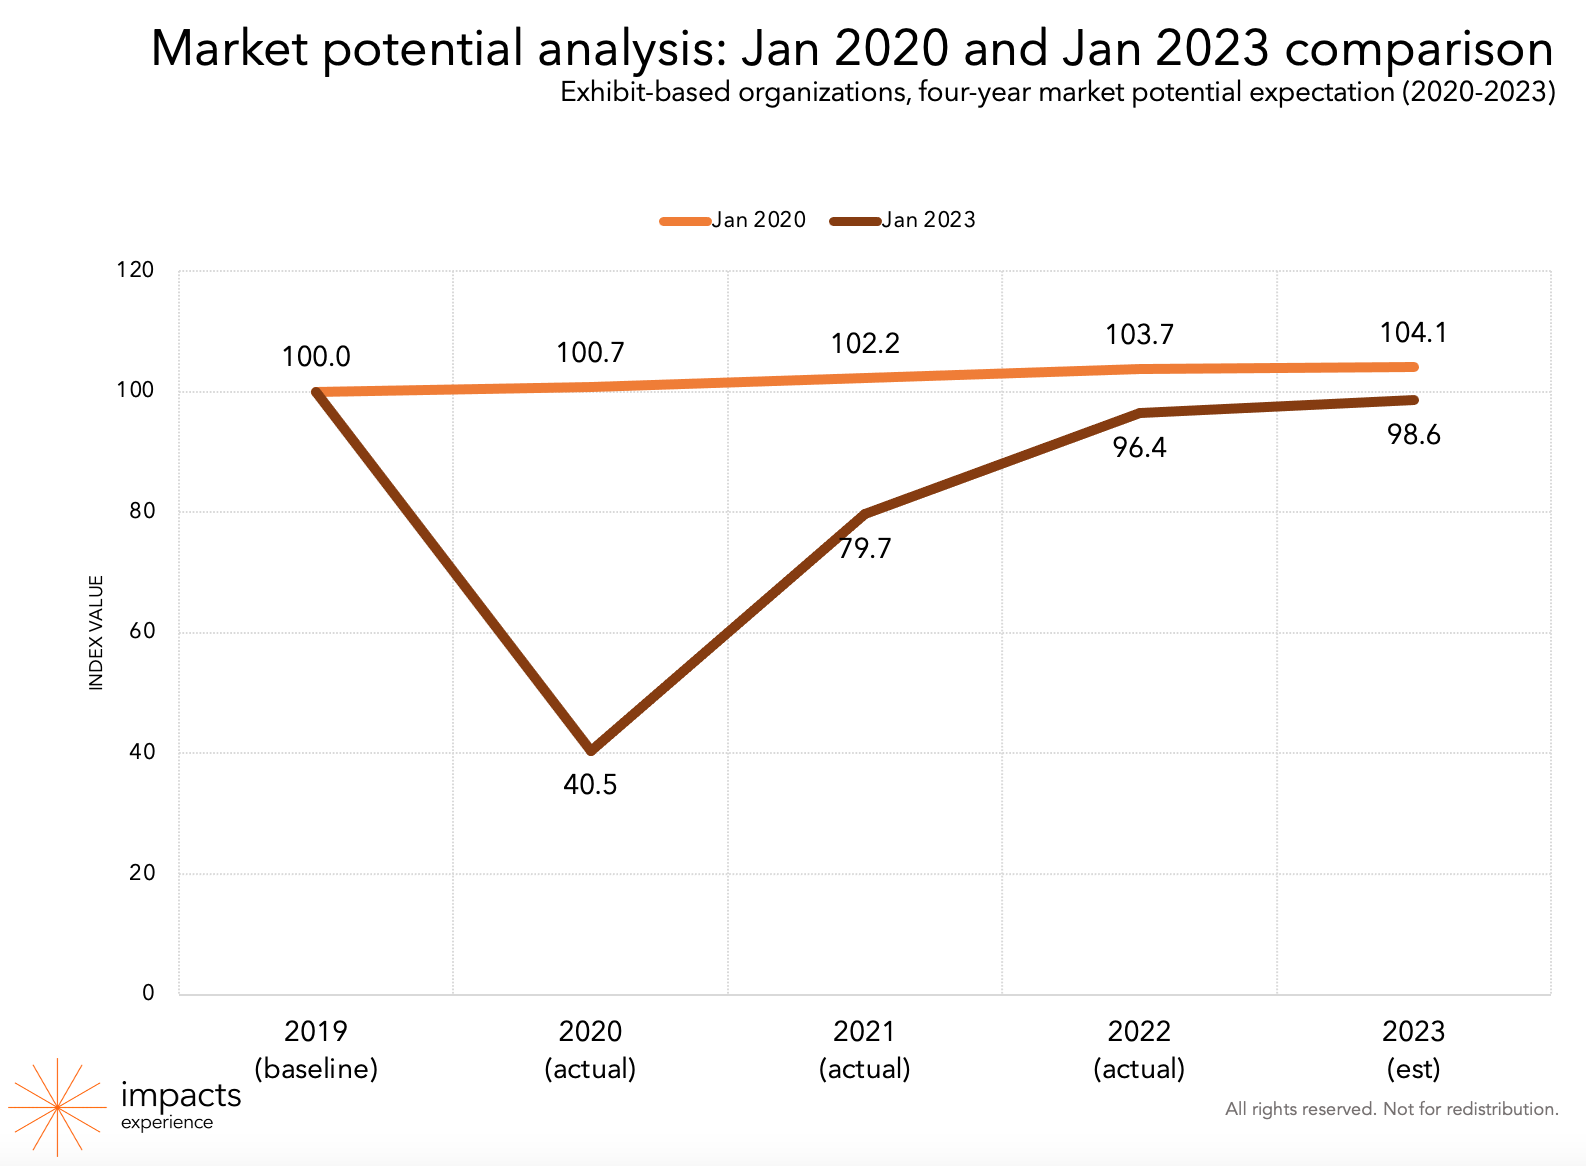
The orange bar shows attendance projections as of January 2020 contemplative of both the most recently completed year’s actual attendance numbers (“2019 baseline”) and projected future attendance levels. In these charts, 2019 actual attendance numbers are represented by an index value of 100. Some entities welcome one million visitors and some welcome ten thousand; standardizing actual past attendance numbers to an index value of 100 allows us to collectively consider attendance for many institutions at once. Comparing past performance to future engagement opportunities allows us to quantify expectations in terms of likely changes relative to past performance.
For example, a future market potential value of 110 when compared to a baseline value of 100 would suggest a 10% increase in expected attendance. The outcomes of the market potential models completed in January 2020 indicate that an exhibit-based organization welcoming 100,000 visitors in 2019 could have reasonably expected to welcome 103,700 visitors in 2022…if the pandemic hadn’t occurred.

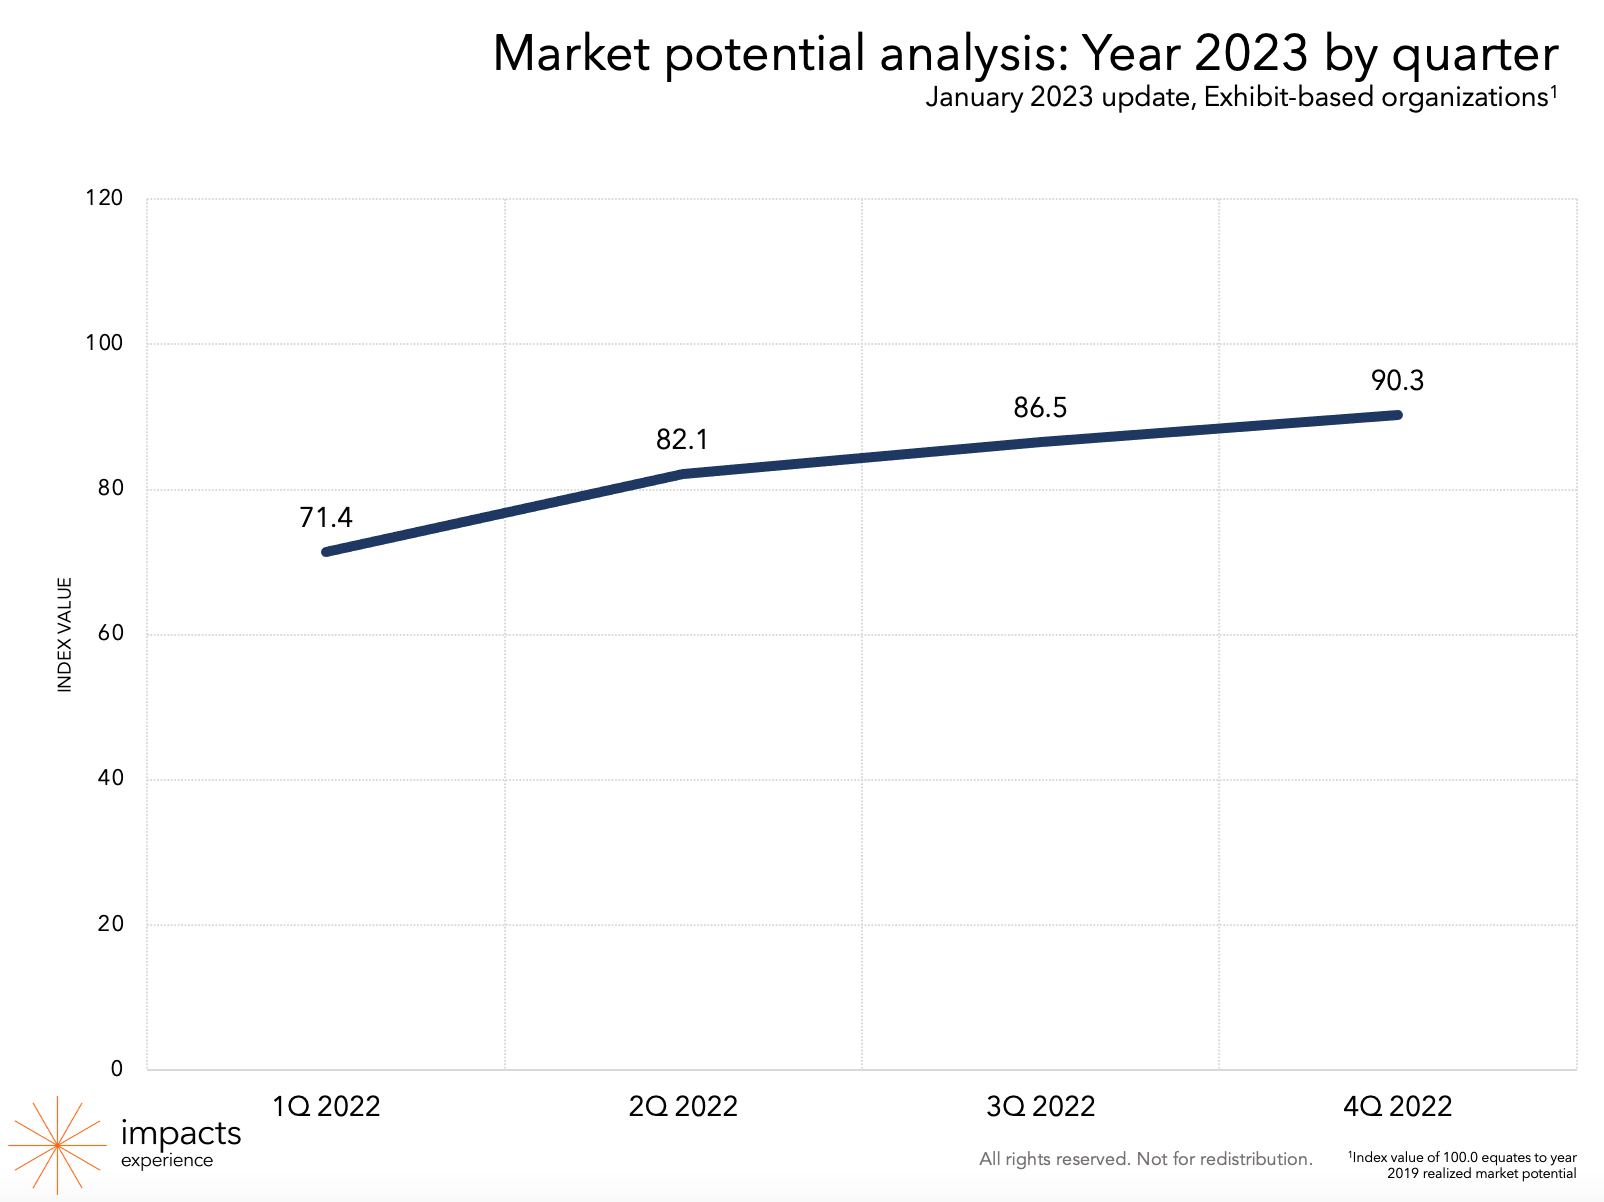
This chart shows the percent attendance expectation for each quarter in 2023 compared to the same periods in 2019. As you can see, the third and fourth quarters of 2023 project to perform very similarly to Q3 2019 actuals. Overall, for the exhibit-based cultural industry, projections suggest a near return to 2019 attendance levels.
What attendance can performance-based entities expect in 2022 by quarter?
Performance-based cultural organizations include entities such as theaters, orchestras/symphonies, and ballets. The actual attendance to these types of cultural entities in the United States averaged 80.8% of 2019 attendance in 2022. As of January 2023, the current market potential for performance-based organizations for the calendar year 2023 is 82.7% of their 2019 attendance.
Critically, market potential assumes that programming and the opportunities to engage through onsite attendance are similar to previous years. Thus, actual attendance may be lower if entities have continued to reduce their programming in response to the pandemic. In fact, this is the very reason for the larger-than-usual variance in projections and actual attendance in 2022. As of January 2022, annual market potential for that year was projected to be 85.9% of 2019 attendance. However, not as many performance-based organizations returned to their 2019 programming as anticipated, and there were thus fewer opportunities to attend performance-based organizations in the US than originally projected. This is a good example of how our industry’s own programmatic decisions can impact market potential after the start of the year.
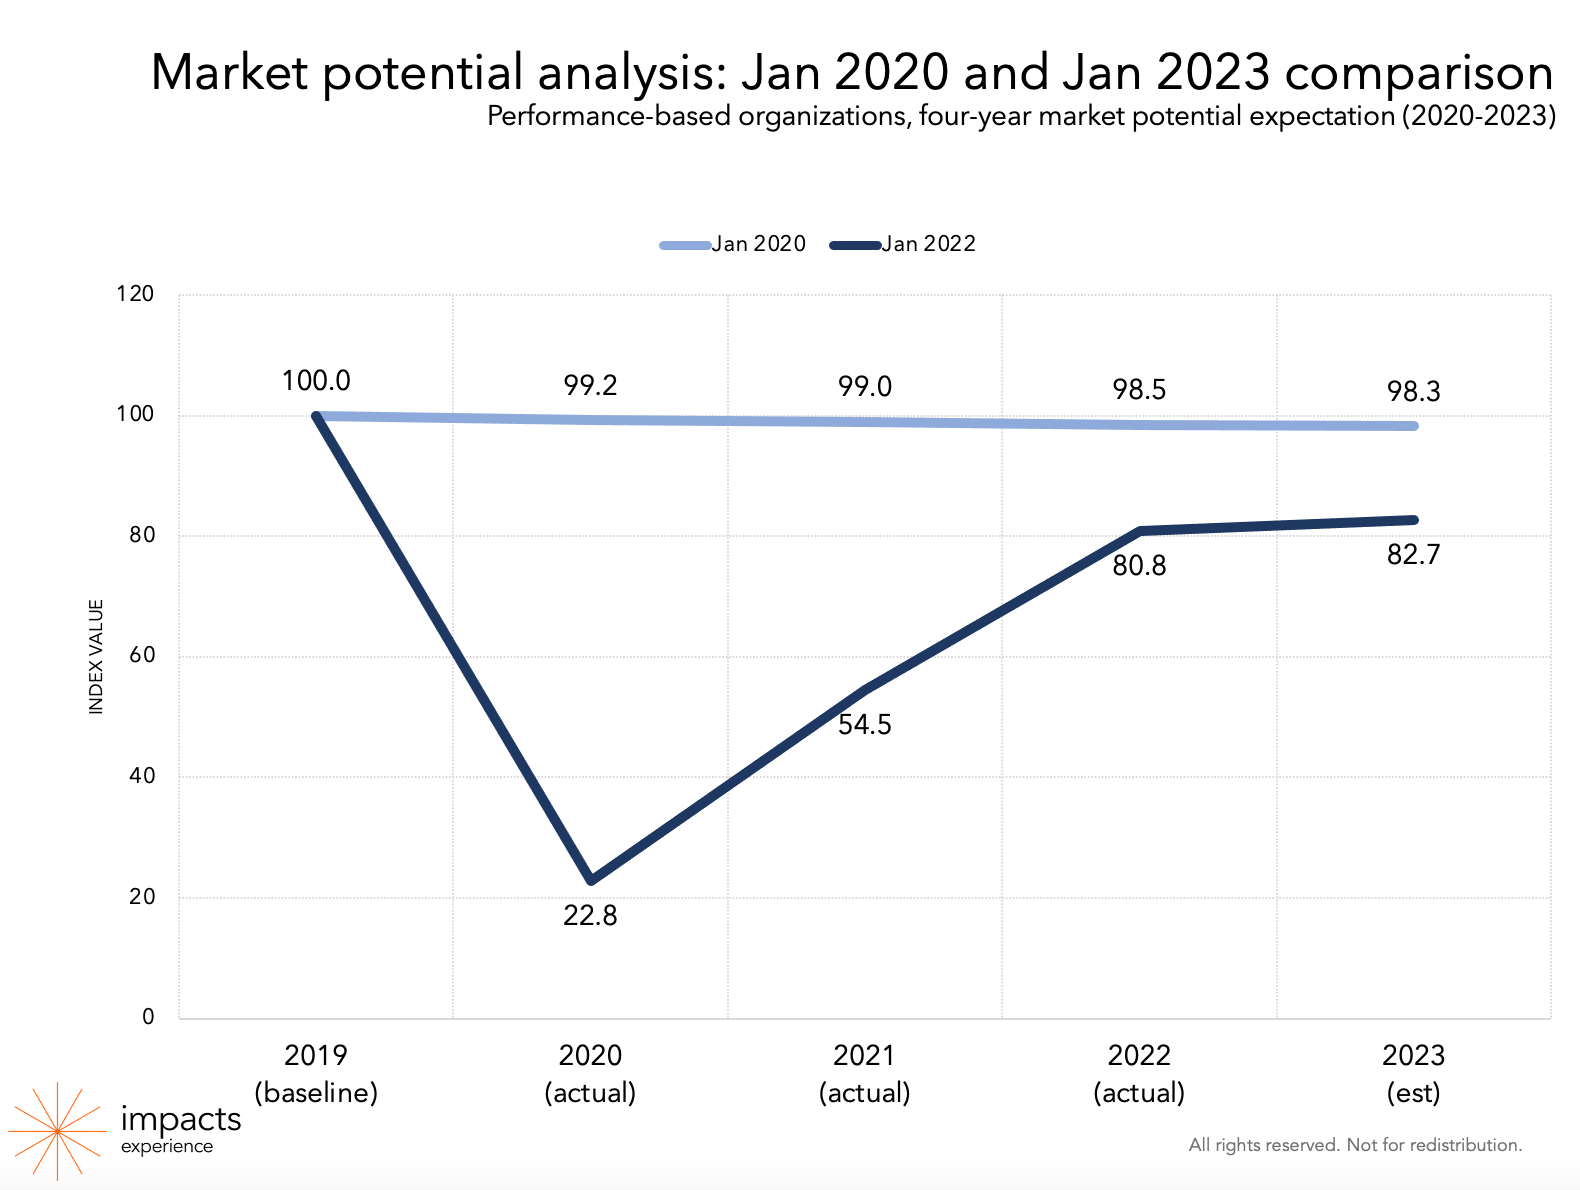
You’ll notice that even before the pandemic, market potential for performance-based institutions was generally in decline. Though theater audiences can vary significantly based upon the offered programs, the historic audiences for symphonies/orchestras and other performing arts institutions are experiencing a phenomenon that IMPACTS Experience calls negative substitution of the historic visitor. In short, core audiences are aging and not being replaced by a younger and more diverse generation at a pace that allows for stable market potential.
Remember again that this chart shows the percent attendance for each quarter when compared to the same period in 2019.
These data continue to suggest that performance-based organizations will be slower to recover to their pre-pandemic performance levels when compared to exhibit-based organizations. This may be due in large part to the perceived increased health risks associated with indoor environments that are often associated with a performing arts experience. In fact, current projections suggest that performing arts organizations will not reach actual 2019 levels industry-wide for the near-term foreseeable future.
Why hasn’t overall market potential exceeded 2019 attendance?
1) For performance-based organizations, often necessary and leaner programmatic changes further shrank market potential.
There are several fundamental challenges facing performance-based organizations right now that have been exacerbated by the pandemic and its attendant implications. Some performance-based entities – such as symphonies – have comparatively older patrons perhaps most impacted by the pandemic. And many of these same organizations are also facing perception-based challenges surrounding diversity and inclusion to a greater extent than are exhibit-based entities. These entities must also grapple with fundamental shifts in how people prefer to take in performance-based content and information in our increasingly digital and interactive world.
These challenges are not new for these organizations. However, the research in this article shines a light on how market potential in 2023 is impacted by (often necessary) decisions made in 2020 and 2021 that may have resulted in a net programming reduction.
2) Redistribution of demand is proving durable
Institutions may have expected the demand for different cultural experiences to return to pre-pandemic levels by now. In other words, one might think that the folks who once enjoyed going to the theater over the zoo would by now be returning to their old habits. But that’s not the case. The demand for onsite cultural engagement remains redistributed away from some organization types and towards others.
Critically, there remains a redistribution of demand away from stationary, indoor activities and instead towards outdoor activities or those that allow for freedom of movement. Redistribution of demand still dramatically benefits parks, gardens, zoos, aquariums, and some museums. However, this redistribution is still coming at the expense of several kinds of performance-based activities. Even as we all begin to recover from the pandemic, we still see that certain preferences developed over the past few years are proving durable.
3) There will be increased competition for out-of-home leisure time in 2023
Even in 2022, we began picking up increased competition on the horizon for 2023 as we collected research on people’s plans for the coming year. As people begin to settle in to their “new normal” behaviors, we see they are anticipating taking part in several activities that they missed. However, organizations can’t depend on this anticipation; pent-up demand for cultural organizations during the pandemic has largely been realized.
Furthermore, it’s getting harder and harder to encourage people to leave their comfy couches these days, and that makes it more difficult to inspire a visit to a historic site or a theater performance. The solution to this – alongside thoughtful and strategic programming – is special consideration to marketing as we live in an increasingly targeted world.
There are a handful of cultural organizations in the US among the 224 we monitor who had a great 2022 – busting market potential projections with sustained audience acquisition investments, smart marketing, and clever engagement strategies. Interestingly, these organizations all (and we mean all) have one thing in common: They did not shy away from marketing investments during the pandemic. These organizations all sustained meaningful marketing investments – even during periods of business interruption and facility closures – and are thus not confronting the often prohibitively expensive challenge of “buying back” lost audiences. Of course, most entities were forced to make hard decisions during the pandemic, and many may have been forced to cut marketing investments knowing full well what a challenge this might be for their organization’s future. We’re observing the outcomes in the market potential research now in terms of which organizations have essentially recovered, and which are continuing to struggle to find their financial footing.
4) The imitative value of lost attendance from the last two years will take time to replace.
Did you know that when a museum has an unexpected closure – due to weather, an event setup, or anything else – the museum doesn’t lose only the attendance for that day? For every one person who did not walk in the door that day, the museum actually loses 1.25 people over the year. Why? Because when a cultural organization loses attendance, it doesn’t only lose those individuals, it loses all their social media posts, word-of-mouth endorsements, and stories shared with others.
What people say about your organization is much more important in driving its reputation than what it says about itself. (We call this “imitative value” at IMPACTS Experience if you are up for some behavioral economics jargon.) Visitors and patrons are by far an organization’s best marketing and advertising. When entities lose them, they lose their stories.
During the pandemic, cultural entities lost attendance and thus lost valuable word-of-mouth endorsements related to their onsite experiences. It will take time, but the good news is that if we can keep engaging individuals, then we can keep working to rebuild these endorsements. (Hint: Facilitating the sharing of these stories on social media or by providing noteworthy experiences onsite that people want to share with others can help speed this up!)
Indeed, increased attendance in 2022 compared to 2020 and 2021 started the path to gaining back lost endorsements, but it’s a long, long road. It will realistically take some time.
Welcome to 2023, cultural executives, board members, and staff members.
It may be another year considering our surroundings as the dust settles, but your hard work adjusting, evolving, strategizing, and creative problem-solving has helped keep your communities educated and inspired. Current projections suggest that this year may be on par with 2019 in terms on nationwide expectations – and that’s a win for recovering and getting our industry’s feet on solid ground.
We look forward to publishing trends related to market potential and reporting any big developments that we may encounter. Please let us know if IMPACTS Experience may be of service with more specific research as you make your way through the year ahead.
We’ve all got our attendance projections in hand, and our communities to inspire.
IMPACTS Experience provides data and expert analysis to many of the world’s leading organizations through its workshops, keynote presentations, webinars, and data services such as pricing studies, market potential analyses, concept testing, and Awareness, Attitude, and Usage studies. Learn more.
We publish new national data and analysis every other Wednesday. Don’t want to miss an update? Subscribe here to get the most recent data and analysis in your inbox.