Suzi-k [CC BY-SA 3.0], via Wikimedia Commons.
Patrick M. Rooney, Where Have All the Donors Gone? The Continued Decline of the Small Donor and the Growth of Megadonors, NonProfit Quarterly, 4 December 2019
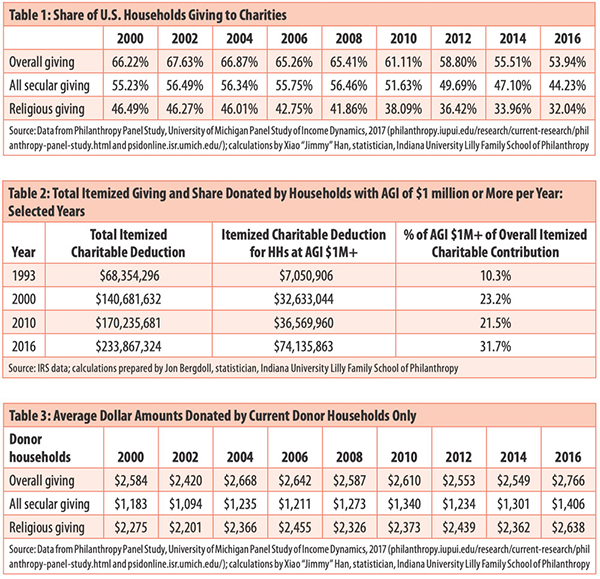
In 2016, 53.9 percent of American households donated something to a legally recognized charity. This is down 1.5 percentage points from the prior wave of data in 2014, 11.5 percentage points since the Great Recession, and almost 14 percentage points from the peak level, in 2002. In other words, one in five former donors in the early waves of the study are now not giving anything to legal charities in any given year.
Table 1 shows that the share of Americans giving at all to 501(c)(3)s continues to erode. (Note that the dataset used by this table represents the bottom 92 percent of U.S. households for income and bottom 97–98 percent of households for wealth. The panel does not include enough observations in the top 2–3 percent of income earners to be representative.)1
Meanwhile, big donors are playing an even bigger role than in earlier years. First, itemized giving by those with an adjusted gross income (AGI) of $1 million or more in any given year has grown dramatically over the last couple of decades (see Table 2)—in fact, it has more than tripled, from 10.3 percent in 1993 to 31.7 percent in 2016 (the most recent year available from the IRS of highest income earners). It is also up two percentage points from 2015, when it was 29.8 percent.
There is no doubt that the change in the tax laws will affect this picture moving forward (as the number of itemizers plummets, given the tax bill changes);2 but the trend of the very highest income earners accounting for dramatically larger shares of total giving does not seem likely to change.
In an article published by the Nonprofit Quarterly in fall 2018—“The Growth in Total Household Giving Is Camouflaging a Decline in Giving by Small and Medium Donors: What Can We Do about It?”—I demonstrated that small donors were disappearing and larger donors were increasing their share of giving.3 Now I provide evidence that these trends are continuing—if not accelerating—and I briefly articulate some ideas on what might be done to ameliorate these challenges.
Where Have All the (Small) Donors Gone?
Let’s review some updated data on these trends to the extent feasible. This decline in donorship holds true for giving overall, gifts to congregations (labeled “religious giving”), and gifts to other (non-congregational) charities (labeled “all secular giving”)—setting aside for now the fact that many gifts categorized as secular gifts are actually donated based on religious values and/or to religiously affiliated charities, but ones whose primary mission is not faith fulfillment, so they are labeled perhaps too generically as secular.4
Giving to other charities (labeled “secular giving”) is down almost three percentage points from the prior wave (2014) to the most current wave (2016). Secular giving is down over twelve percentage points from its peak before the Great Recession. As a rate of change, this means that 22 percent fewer households are donating at all to these non-congregational charities. (See Table 1.)
Giving to congregations has trended down with each additional wave of the panel study. In 2016 (the most recent year for which these data are available), the share of households giving to congregations is down to 32 percent, which is almost two percentage points lower than the prior wave in 2014, and almost ten percentage points lower than before the Great Recession. It is 14.5 percentage points lower than when the panel started, in 2000. An alternative way of expressing this is that almost one-third fewer American households are donating to congregations in the most recent panel wave in 2016 than they did in the first wave in 2000.
On the other hand, when we look at only those households who donated in any given year, we see that they are actually increasing how much they give each year both to congregations and to other charities, hence to overall giving as well (see Table 3). This trend has been characterized elsewhere as “donors down, dollars per donor up.”5 Given the uniformity of this trend, I will let Table 3 speak for itself.
The Big Donors Are Getting Bigger
As I described earlier, the share of itemized donations by very high-income households tripled between 1993 and 2016. That paints a vivid picture, but there are several other factoids that triangulate to this truth of the growing share of big donors in total household giving. First, I review the Chronicle of Philanthropy’s list of the top fifty donors and its subset of the top ten donors from 2000 to 2018. Second, I examine the explosive role of DAFs, both in the dollar volumes and as a share of household giving. Finally, I look at comparative evidence from available research around the world to ascertain whether these trends in the United States parallel similar phenomena globally.
Not only are the bigger donors getting bigger—the biggest donors are also getting to be even “more biggest” (bad grammar intended for dramatic effect; apologies to all of my prior English faculty). Table 4 shows total giving by the top fifty largest and top ten largest donors as reported annually by the Chronicle of Philanthropy,6 as well as total giving and total household giving (both from Giving USA).7
My research team and I have combined these two distinct data series to calculate the giving by the top fifty and top ten donors each year as a share of total household giving. We have created a subset of the Chronicle’s top fifty donors to examine how similar or different the top 10 percent of donors are compared to the rest of the top fifty (i.e., the “bottom forty” donors in the top fifty). (See Table 4.) It’s important to note that the top fifty data only go back to the year 2000, so definitive estimates of longer-term trends are not possible; but some interesting factoids emerge from these data.
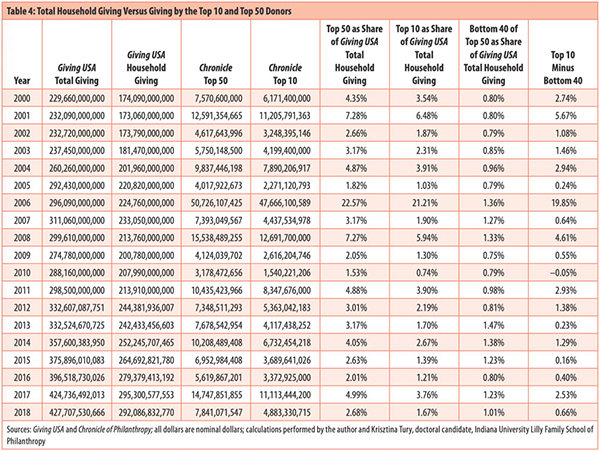
First, the top ten donors of the top fifty account for an average of 78 percent (mean versus 69 percent for the median) of the total giving by the top fifty donors. Second, in all but one year, the top ten donors gave more than the next forty combined. Third, in that year (2010), the top ten still accounted for 48.5 percent of the total giving by the top fifty. Fourth, and perhaps not surprisingly, there is a great deal of volatility in the year-to-year amounts given by the top fifty. While some of these donors are repeat donors, others are givers of bequest gifts, which by definition are one-time gifts. Fifth, the top fifty donors play an important role in household giving, ranging from 1.5 percent to 22.6 percent of total household giving in any given year. The top ten donors ranged from 0.7 percent to 21.2 percent of total household giving. While Table 4 shows some dramatic swings (e.g., Warren Buffett’s big gifts), it also shows that even among the top fifty donors, the biggest donors (top ten) account for a disproportionate share of the dollars donated by the top fifty.
Evidence from Donor-Advised Funds
While some donor-advised funds (DAF) hosts are trying to create a more democratized version of DAFs with lower entry requirements, it is clear that DAFs are growing and that they remain largely the realm of large donors. According to the most recent report from the National Philanthropic Trust on DAFs in 2019, between 2014 and 2018 the number of DAF accounts has more than tripled (202 percent)!8 (See Table 5.) This growth has been going on for years, but has accelerated since the tax code was being discussed and then enacted: The number of accounts grew 62 percent from 2016 to 2017, and then another 55 percent from 2017 to 2018—or 152 percent growth from 2016 to 2018 combined!
The dollar amounts contributed to new and existing DAF accounts have also grown rapidly over the last five years (86 percent), but not nearly as rapidly in the past two years as the number of accounts: 48 percent growth in total amounts contributed to DAFs versus 152 percent growth in the number of DAF accounts from 2016 to 2018. The changes in the tax code combine to make it unlikely that most giving households will be able to deduct their charitable gifts, including most of the tax filers who were itemizers in prior years.
The key factors driving most former itemizers into becoming non-itemizers moving forward are the near doubling of the standard deduction and the effects of the state and local taxes (SALT) limits. Clearly, many middle-, upper-middle-, and lower-upper-income households have reacted to the expected loss of their tax itemization status by creating a DAF account (or expanding one already in place). This may be a strategy to “bundle” multiple years’ worth of gifts into one year, thereby creating a large enough deduction in some years to move back to tax itemization status. This would permit the deductibility of the same donations—even if not on an annual basis.

The total amounts in DAFs have also grown dramatically over the last five years (73 percent), as have the total amounts paid out in grants (90 percent). (See Table 5.) There are two indicators that have declined over the last five years—dips that seem to be related to the tax-bill effects of tremendous growth, as well. For example, the average amount in each DAF account dropped 43 percent from 2014 to 2018, but all of the decline occurred over the last two years (a 44 percent drop from 2016 to 2018). This effect may be attributable to the following possibilities: The fact that many DAF host organizations have lowered the cost of entry in order to attract new clients; the very high payout rates that many DAF accounts persist in giving; and/or the dilution effects of so many net new DAF accounts formed so rapidly. The second negative signal from the burst in growth in DAF accounts is the modest decline in the grant payout rate over the last five years, from 21.6 percent in 2014 to 20.9 percent in 2018. While there are many potential definitions for payout rates, National Philanthropic Trust employs the commonly used definition for foundation payout rates in these calculations (this year’s grants divided by last year’s total assets, or [grants(year t)/total assets (year t-1)]). While the payout rate bumped up a bit in 2017 (to 22.8 percent), the five-year average has been 21.2 percent, and most years have been within one percentage point of that five-year average.
The facts are that there are over $121 billion dollars in DAF accounts, and over $23 billion in new contributions from DAF accounts were given in 2018 (see Table 5). Grants made to charities from DAF accounts totaled the equivalent amount of 12.7 percent of total household giving in 2018, which is up dramatically from 7.9 percent in 2014—and almost three times its share in 2010 (4.4 percent). The increase in the number of DAF accounts, their total assets and grants, and, especially, the overall “market share” of DAFs as a percentage of household or individual giving demonstrate the growth of “bigger” or “big” donors. This, combined with the reality that we simultaneously saw a decline in the participation rates in giving by the small donors, reinforces the notion of the growth of the big donors and the disappearance of the small donors.
Fidelity Charitable’s latest giving report indicates not only tremendous growth in charitable contributions over time—from $1.1 billion in 2009 to $5.2 billion in 2018 (41 percent per year average annual growth in the dollar amounts in DAF grants from 2009 to 2018) just from Fidelity Charitable’s DAF accounts—but also the scale of these gifts: grants of $1 million or more grew to 582 last year (15 percent over the prior year).9 Also of interest: According to Fidelity’s data, only 3 percent of these DAF gifts last year were completely anonymous.10 Furthermore, while just over one-third (37 percent) of the DAF gifts were granted within a year, 74 percent were granted within five years and 88 percent within a decade.11 While it is quite reasonable to be concerned about the theoretical aspects of a “parking lot” phenomenon, in reality, these micro, account-level data from Fidelity and the aggregated payout rates reported by the National Philanthropic Trust suggest that this criticism of DAFs is an exaggeration wrapped up in a hyperbole (or vice versa, as one prefers).